PLANNER & SITE TEAM GUIDE · Updated November 4, 2026
Create a resource or manpower histogram from an XER file
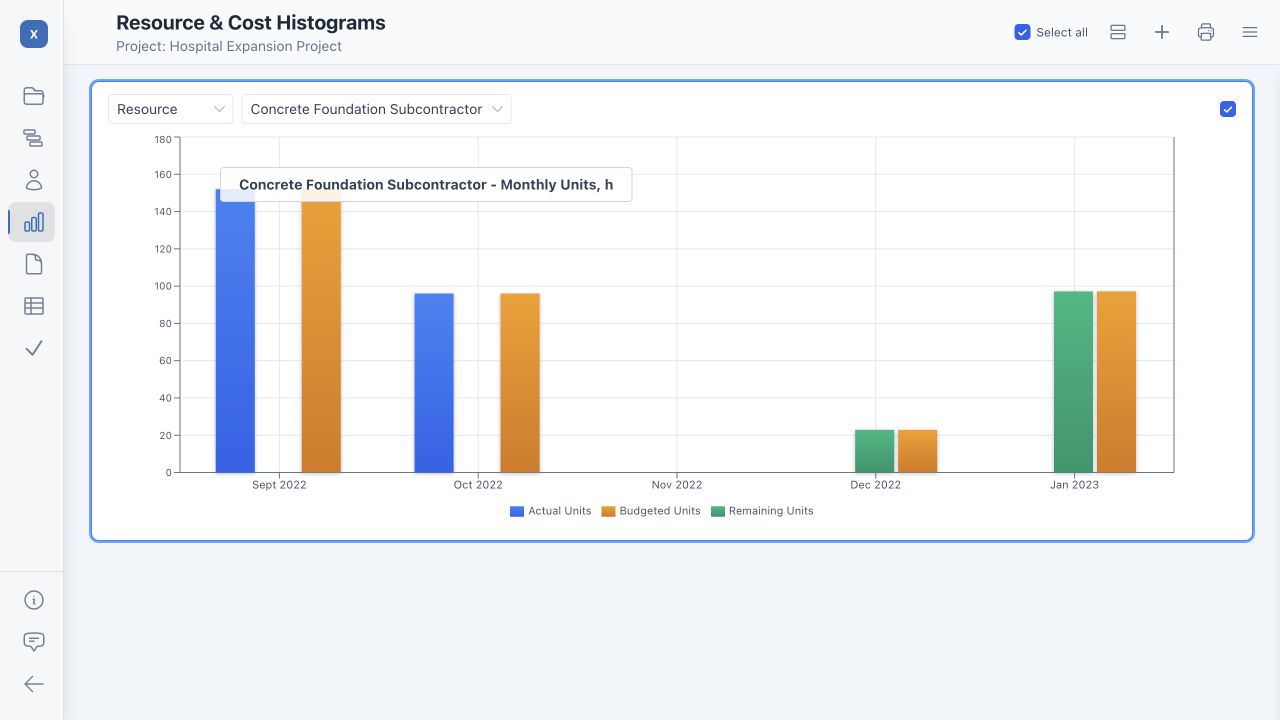
A resource histogram shows when the schedule demands labor, equipment or other resources. In XER Viewer, chart assignment units or costs over time and inspect peaks before a site planning meeting.
What the chart tells a site team
Periodic bars show quantities within each time bucket; a cumulative S-curve shows the running total. Peaks can prompt questions about crew availability, equipment access and work fronts. Oracle describes these as resource usage views derived from schedule assignments. Oracle: resource and role usage.
The export must contain resource assignments and quantities. A schedule without labor loading cannot reveal a reliable manpower plan merely by opening it in a viewer.
Build the chart in XER Viewer
- Open the XER and choose Histograms in the left navigation.
- Add a chart with the + toolbar button. Select the chart before changing settings; use Select all only when you want the settings applied to every chart.
- Open Histogram Options → Data. Choose Units, filter by resource type and select the resource. Choose Cost and a cost account when reviewing expenditure distribution instead.
- Select Daily, Weekly or Monthly. Weekly periods can help with crew planning; monthly periods give a broader overview.
- Choose your series. Show periodic or cumulative Actual, Remaining and Budgeted values as needed. Avoid treating these as interchangeable.
- Make the output clear. In Axes, Bars and Elements, set readable titles, units, colors and legends. Use Grid or Stacked workspace layout to compare charts, then use the histogram print control for a paper copy or PDF.
Labor hours are not headcount
If one week's bar contains 800 labor-hours, it does not mean 800 workers. Assuming each person supplies 40 productive hours that week, the average equivalent workforce is 800 ÷ 40 = 20. This is an illustrative conversion, not a peak crew count or an automatic staffing recommendation.
Confirm whether resource units mean person-hours, crew-hours, equipment-hours or quantities. Account for shifts, holidays, productivity, overtime and overlapping work. The chart's custom divisor rescales values; dividing by 1,000 changes display units, not the meaning of the source assignments.
Review peaks before acting
- Check assignment quantities and dates in the Resource view.
- Ask whether access, supervision and trade interfaces can support the planned demand.
- Compare forecast demand with independently confirmed available capacity.
- Reconcile important periods with P6 and the scheduler's assumptions before committing crews.
These histograms distribute exported quantities using the app's supported calculation rules. They are not actual site attendance records and do not automatically level resources or reschedule work.