PLANNER & SITE TEAM GUIDE · Updated November 4, 2026
Read the critical path and total float in a P6 schedule
A red activity bar is a starting point for investigation. Learn how critical activities and total float help you identify work that threatens completion, then inspect the schedule in XER Viewer.
Critical path, critical activities and float
The longest path follows the driving sequence to project completion. P6 can identify critical activities using that path or a total-float threshold. Those methods can select different activities, so confirm how the scheduler calculated the export. Oracle: critical path.
Total float expresses scheduling flexibility relative to late dates. P6 can calculate it from start float, finish float or the smaller of the two. Constraints, calendars and project scheduling options affect its interpretation. Oracle: scheduling options.
A construction example
Suppose commissioning must follow permanent power. If power energization is on the driving path, a delay can move handover unless recovery is possible elsewhere. A landscaping activity with positive float might have flexibility, but that float does not automatically authorize a delay: access, trade interfaces and contract requirements still matter.
| Float reading | Question for the planner |
|---|---|
| Zero | Is this activity on the driving sequence, or has a constraint removed flexibility? |
| Negative | Which required date or constraint conflicts with the forecast? |
| Small positive | Could this become critical if delivery or productivity slips? |
| Very high | Is the flexibility genuine, or is successor logic missing? |
Inspect it in XER Viewer
- Open the XER and check the project data date. A stale export can misrepresent current priorities.
- Open Gantt and use the filter menu's Critical Path quick filter. Review the filtered activities alongside their dates and status.
- Show Total Float in the activity list using the column controls. Inspect low and negative float along with remaining duration.
- Inspect relationships. Use predecessor/successor and relationship controls to understand the sequence around important activities. Review the Reports → Schedule Report critical-activity and warning sections.
- Share the evidence. Export the styled Gantt to Excel or save a PDF with relevant activity IDs and dates.
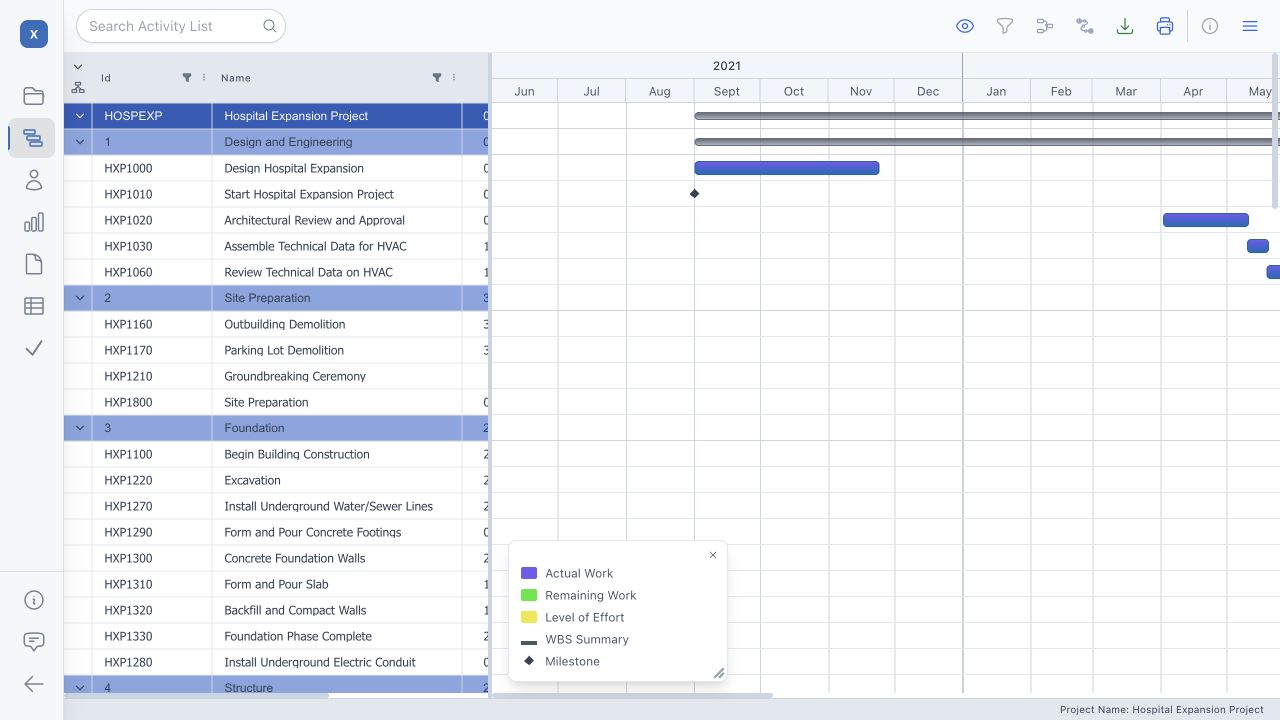
Understand the viewer's critical indicator
XER Viewer uses the exported longest-path flags when its critical-bar method is set to longest path; otherwise its Gantt critical classification uses zero or negative total float. It does not reproduce every possible custom P6 critical-float threshold. Bar preset visibility and colors also affect what you see.
The viewer reads an exported snapshot; it does not rerun the complete P6 scheduling calculation. Ask the scheduler to validate the driving path and scheduling options in P6 when a result looks unexpected.